Bring to life whatever you visualize with our intuitive drag & drop UI features and widgets.
By clicking "Submit", you agree to SuperOps's Terms of use and Privacy policy.
REPORTING
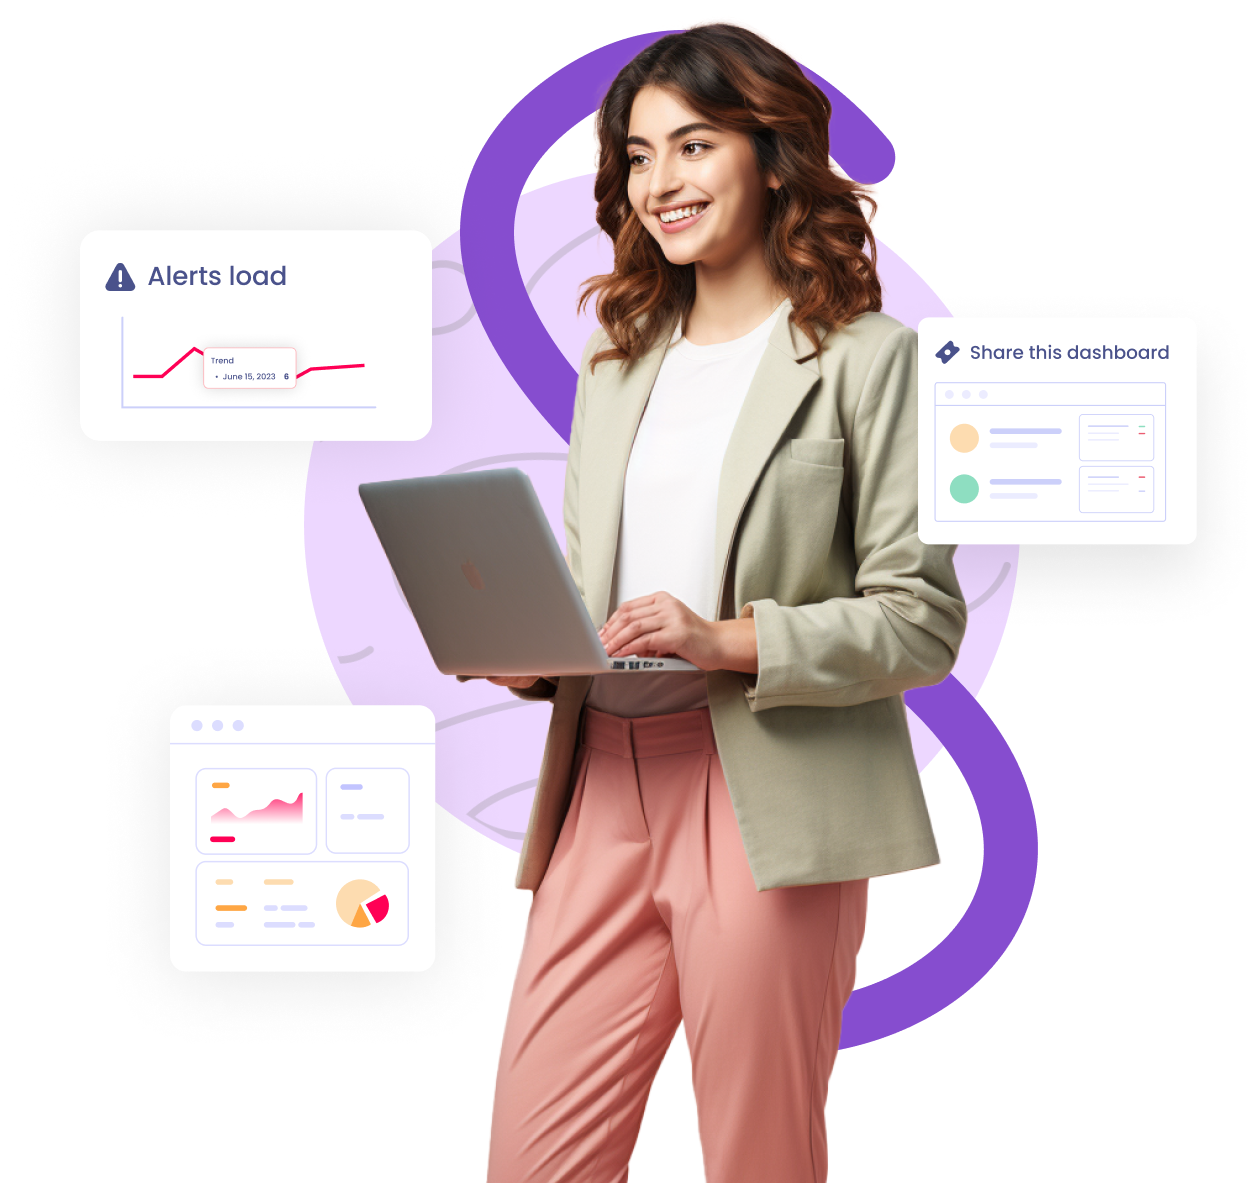
Harness the power of analytics
Use dashboards to create dynamic reports, track KPIs, and gain valuable insights for your business growth.

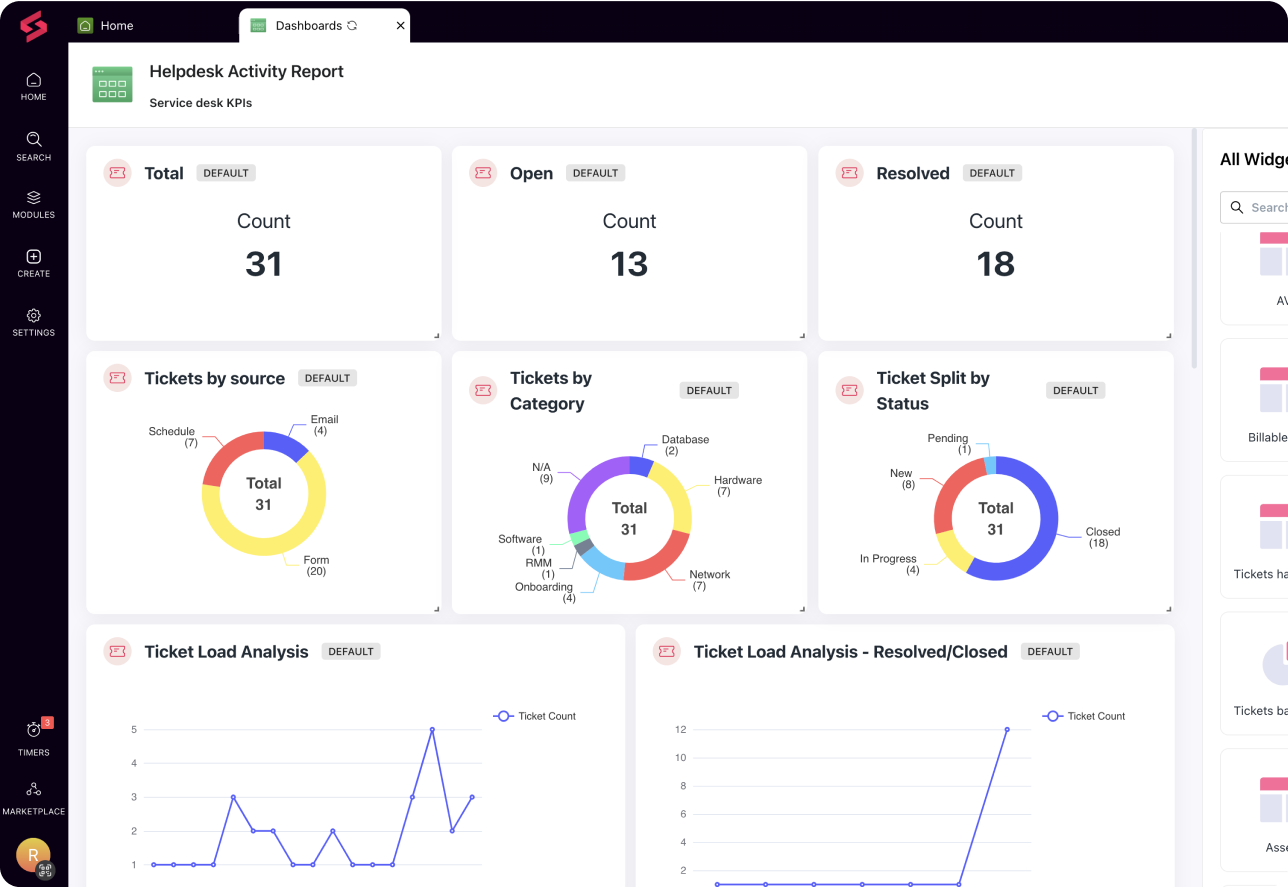
Visualize
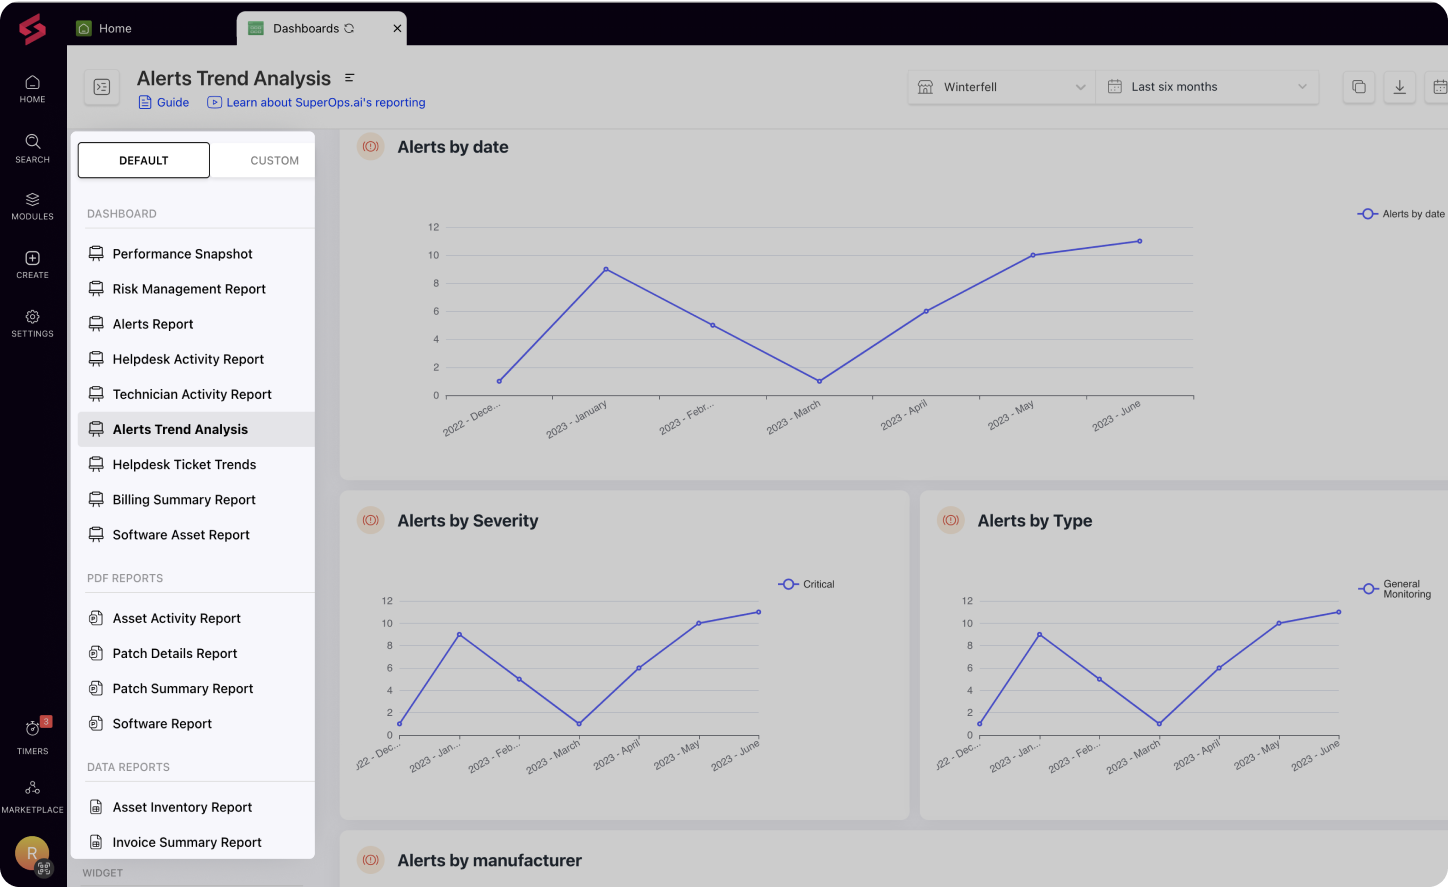
Transform plain numbers into visually meaningful charts
Visualize
Transform plain numbers into visually meaningful charts

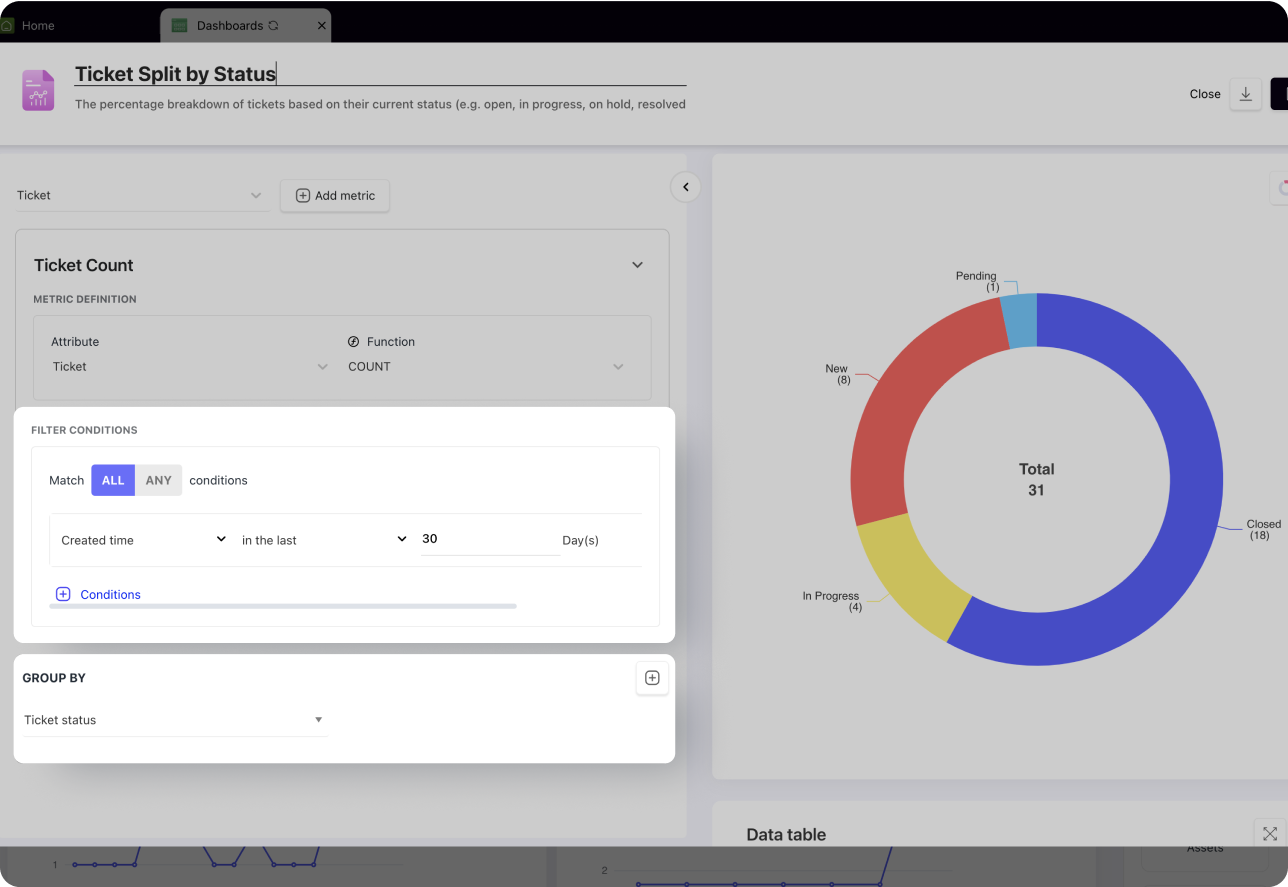
Customize
Build and track reports that capture only the metrics you need

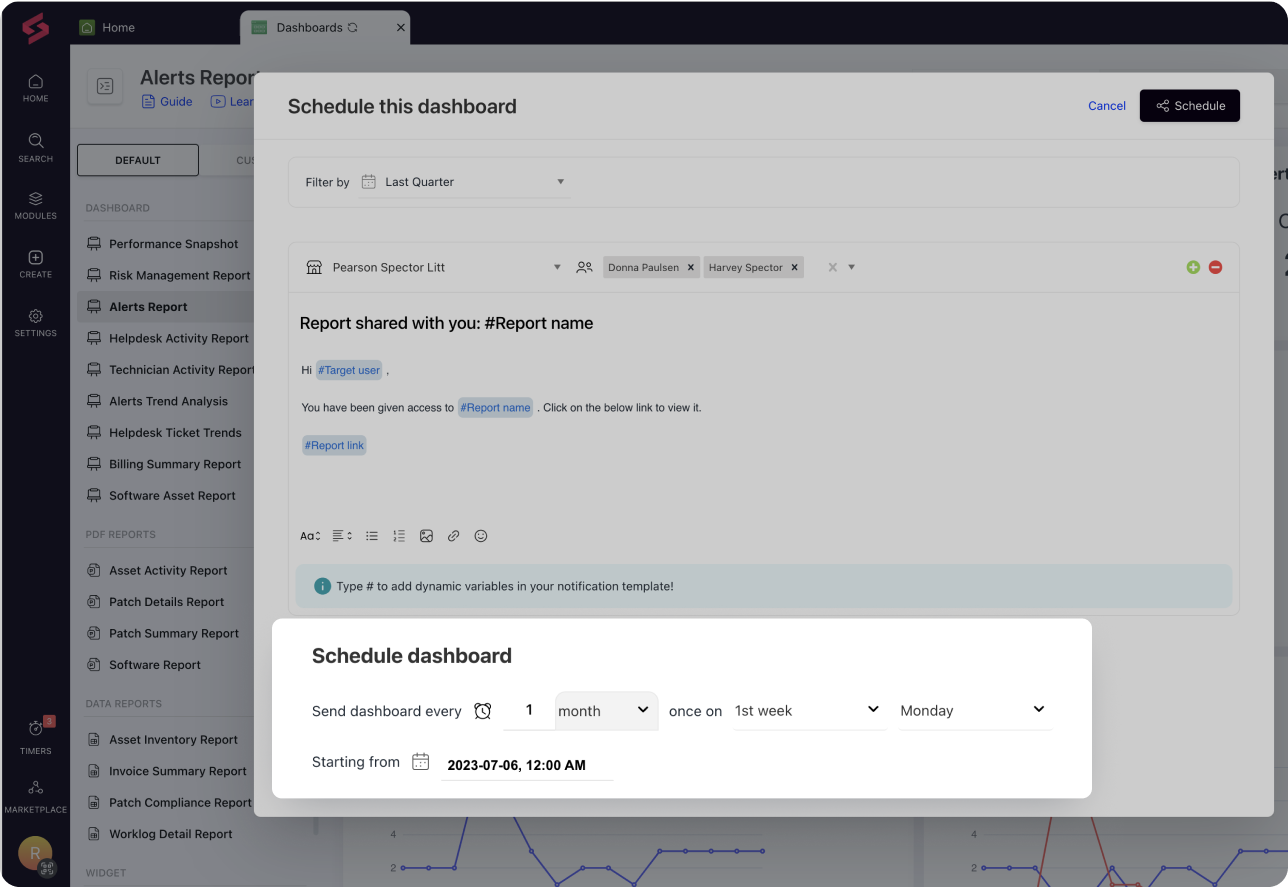
Share
Schedule and share recurring reports with your clients

Make analytics less boring
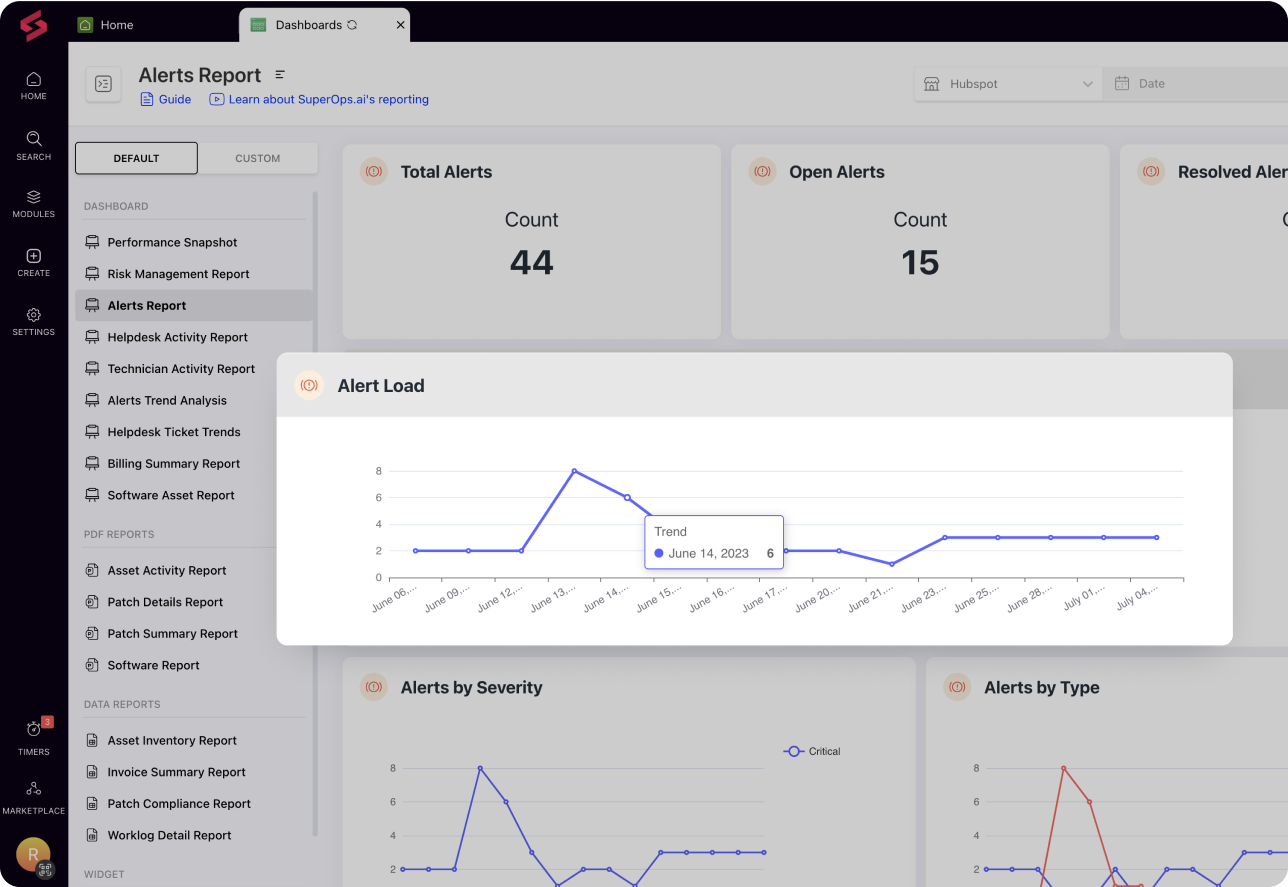
VISUALIZE
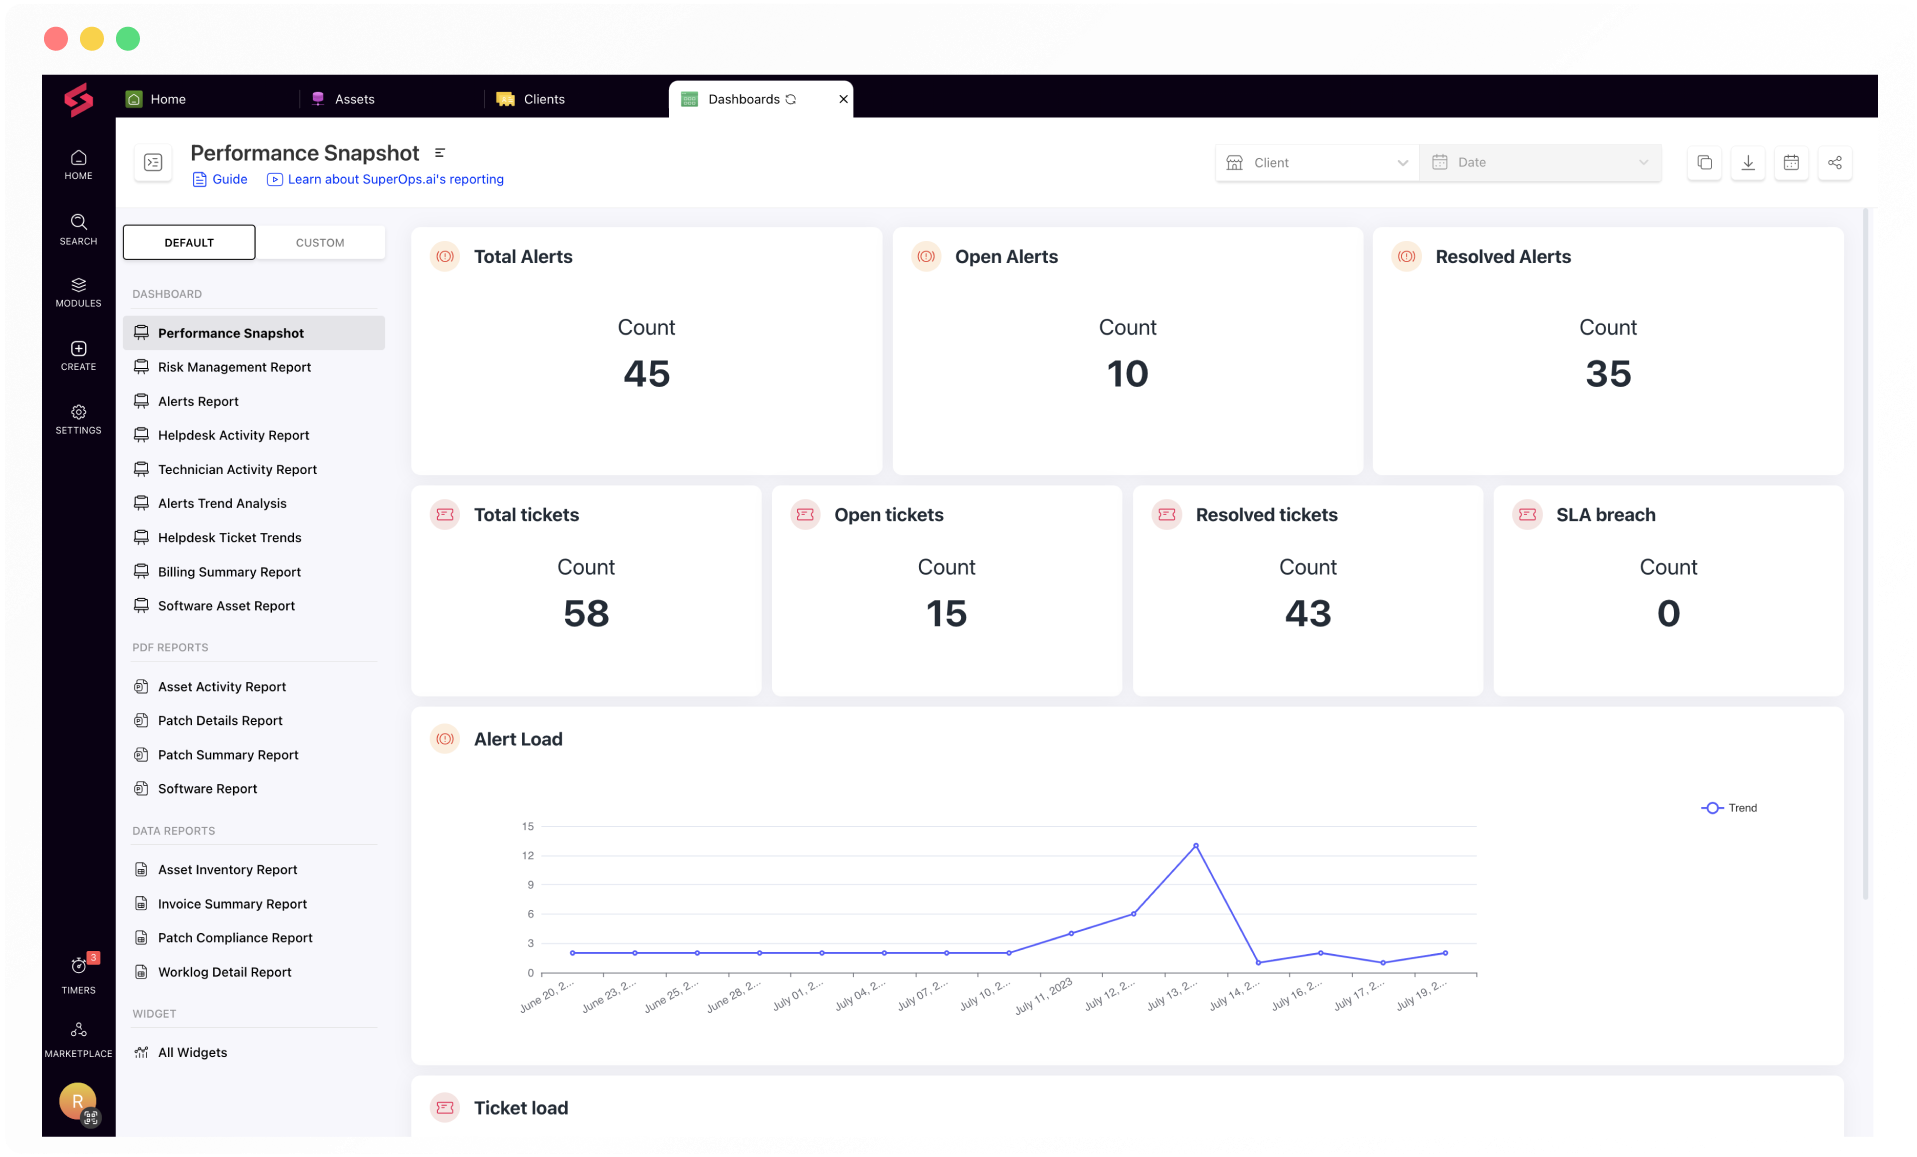
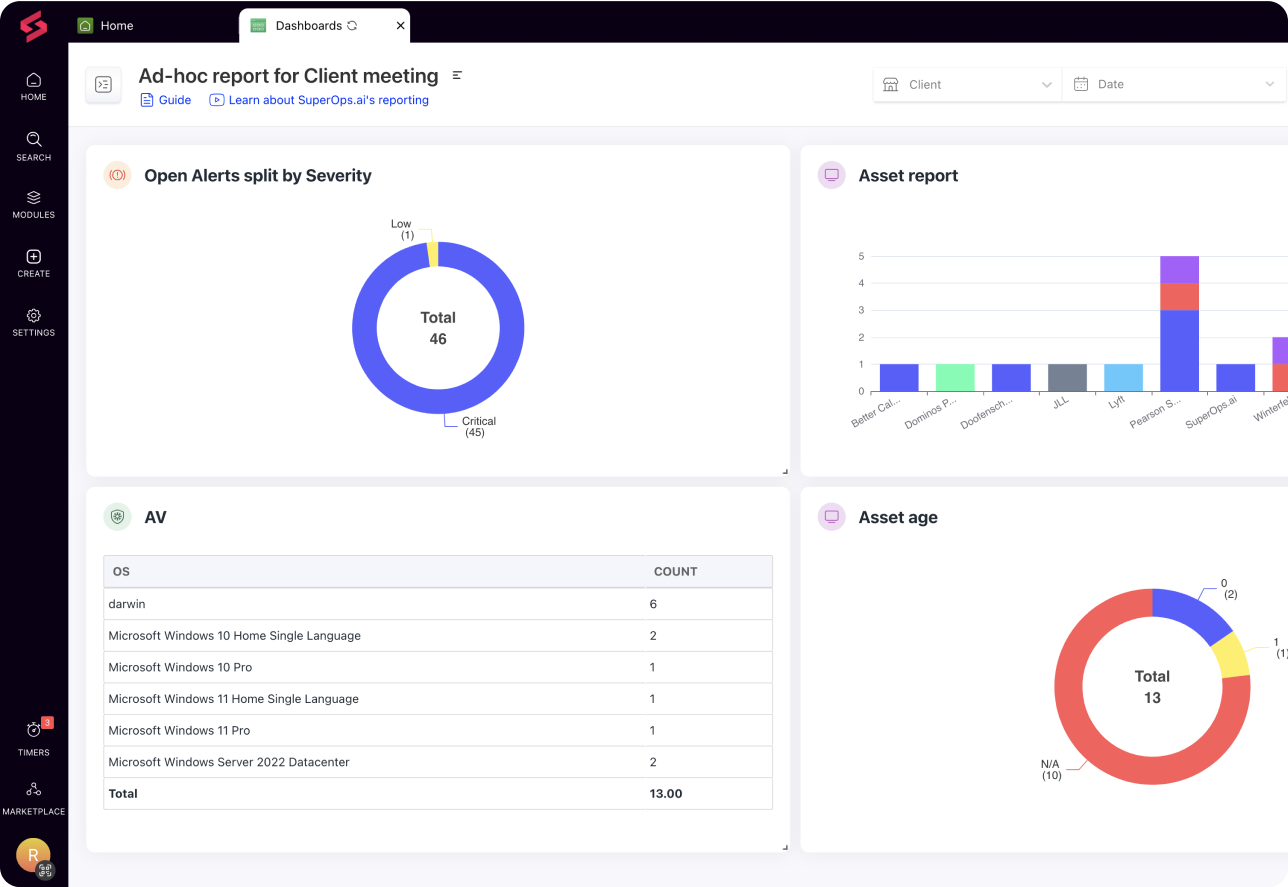
Track your progress and performance
Monitor KPIs and metrics with charts and widgets that help you stay informed and make better decisions.
Create as you imagine them
Don’t miss anything
Shaped to your use-case
COLLABORATE
Build trust with credibility
Demonstrate your value and build trust by keeping clients informed throughout the process.
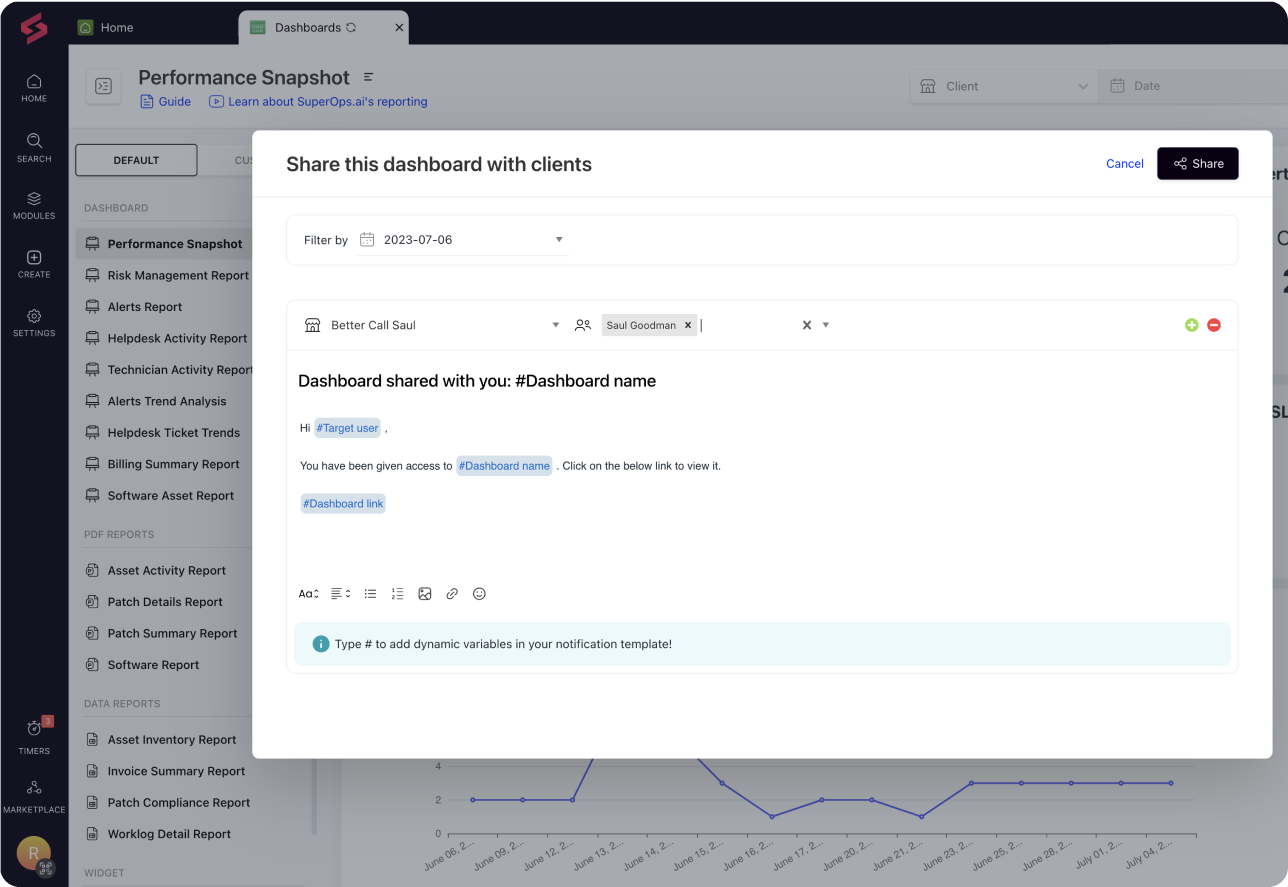
Communicate your value delivery
Share your reports with everyone
Get to speed quickly
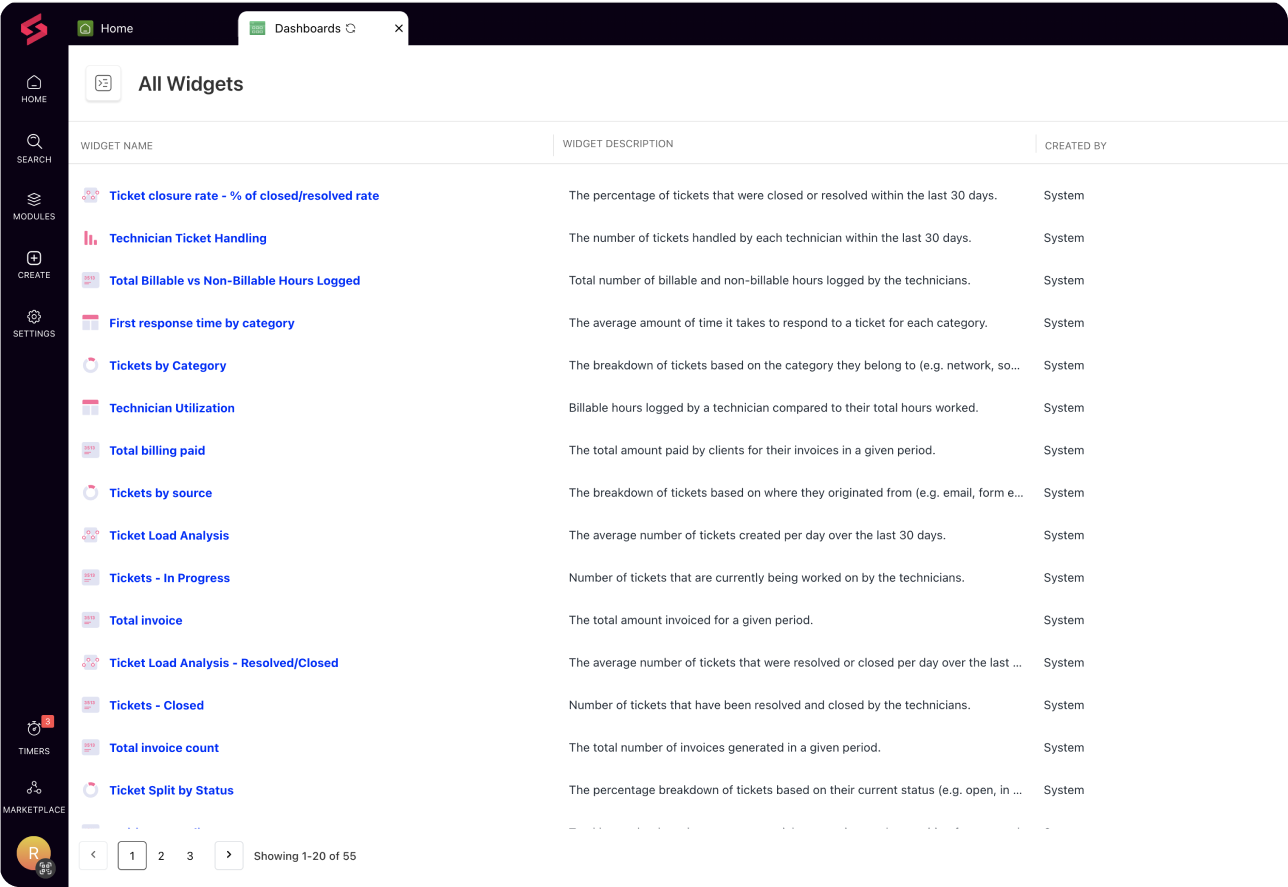
ANALYZE
Measure and analyze metrics for growth
Discover which metrics to track, and incorporate them into your own reports with ease.
Identify your roadblocks
Monitor, pivot and re-strategize
Structure data for better analysis
CONVENIENT
Make better decisions, faster
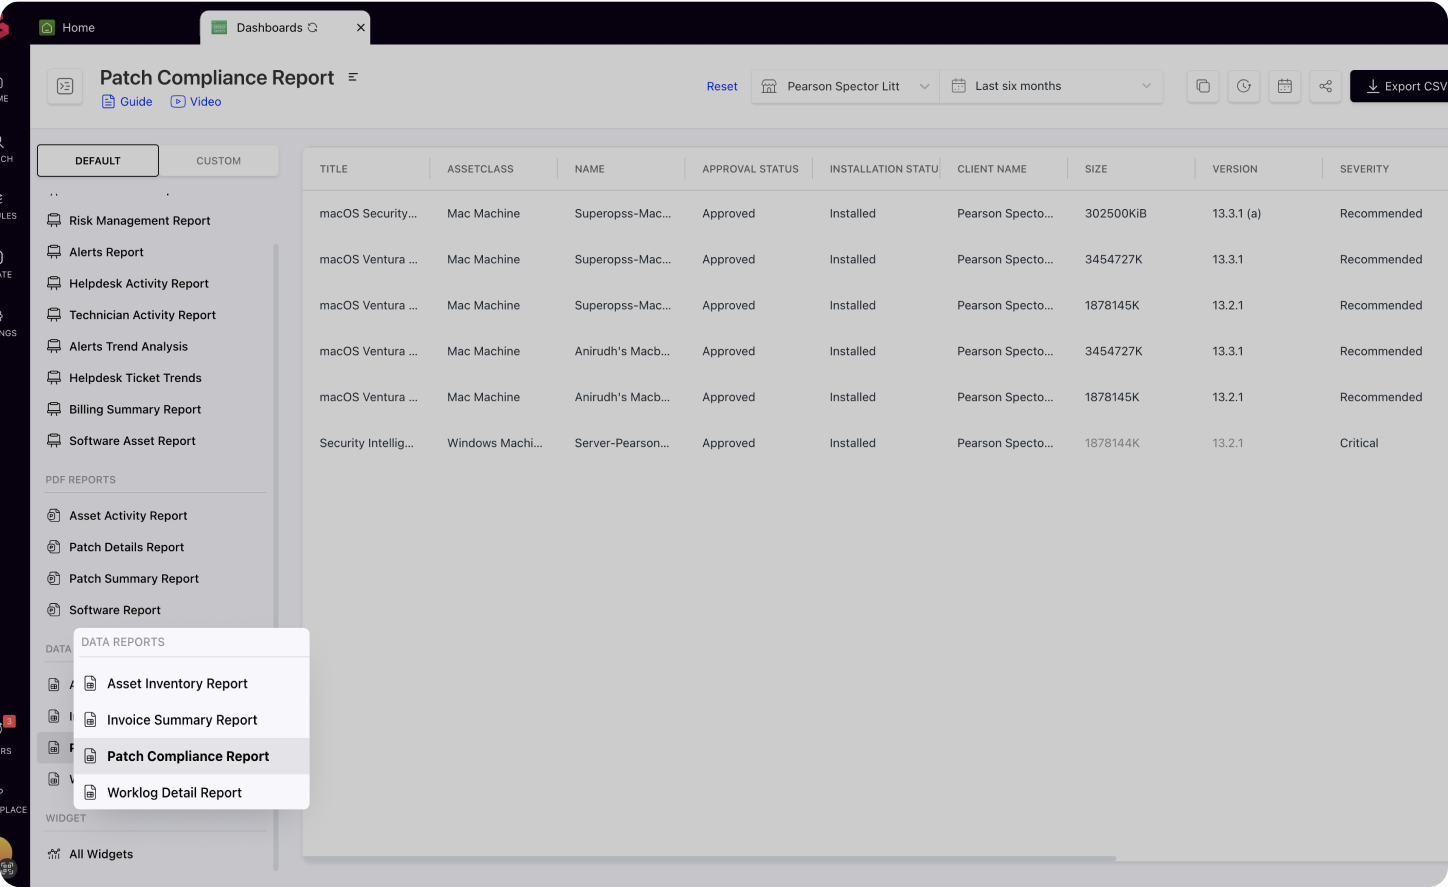
Use our wide variety of reports to monitor all your key metrics with minimal to no effort.
Present comprehensive data as reports
Measure what matters to you
Gain control across all areas
The biggest feature that we use inside the SuperOps platform is Reporting. We're able to tell the customer with reporting for asset management, hey, here are the specs of all your systems, here are the weakest systems that need to be replaced, and that encourages us to be able to make new sales.
Blake Thoennes
Owner at Computer Repair Unlimited
FEATURE TESTIMONIAL

0
Data work needn't be tedious
1
Create charts, build flexible reports, and expedite data-driven decisions with our reporting module.

Thanks for joining our pilot program! We're super stoked!
One of us will get in touch with you in the next 24 hours to talk about the next steps.